 by
by 
And rising and rising…?
At first glance, the atmospheric CO2 concentration is constantly rising, as shown by the annual mean values measured at Maona Loa (ftp://aftp.cmdl.noaa.gov/products/trends/co2/co2_mm_mlo.txt):
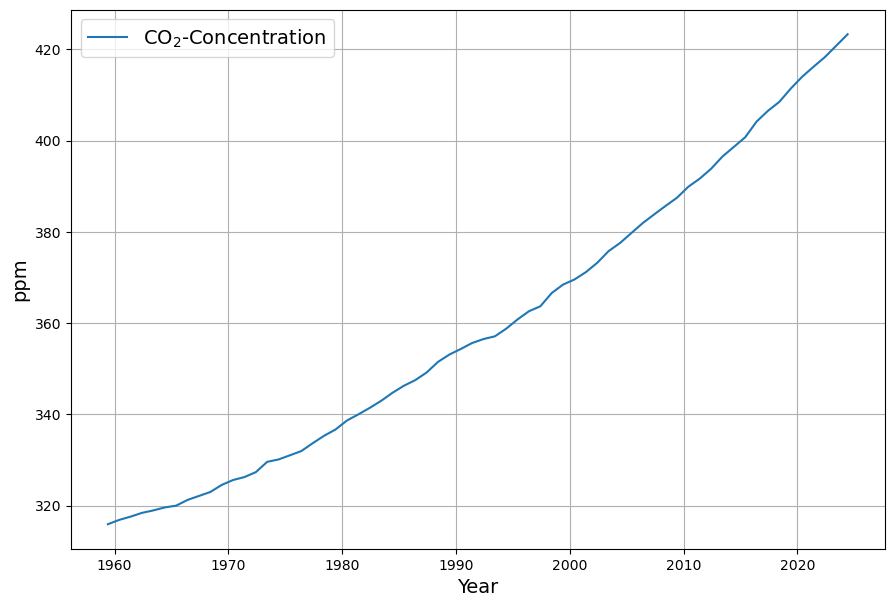
The central question that arises is whether the concentration is growing faster and faster, i.e. whether more is being added each year? If so, the curve would be concave, i.e. curved upwards.
Or is the annual increase in concentration getting smaller and smaller? Then it would be convex, i.e. curved downwards.
Or is there a transition, i.e. a turning point in the mathematical sense? This could be recognized by the fact that the annual increase initially increases and then decreases from a certain point in time.
At first glance, the overall curve appears concave, which means that the annual increase in concentration appears to increase with each year.
The answer to this question is crucial for the question of how urgent measures to curb CO2 emissions are.
Closer examination with the measured annual increase
To get a more accurate impression, we calculate the — raw and slightly smoothed — annual increase in CO2 concentration:
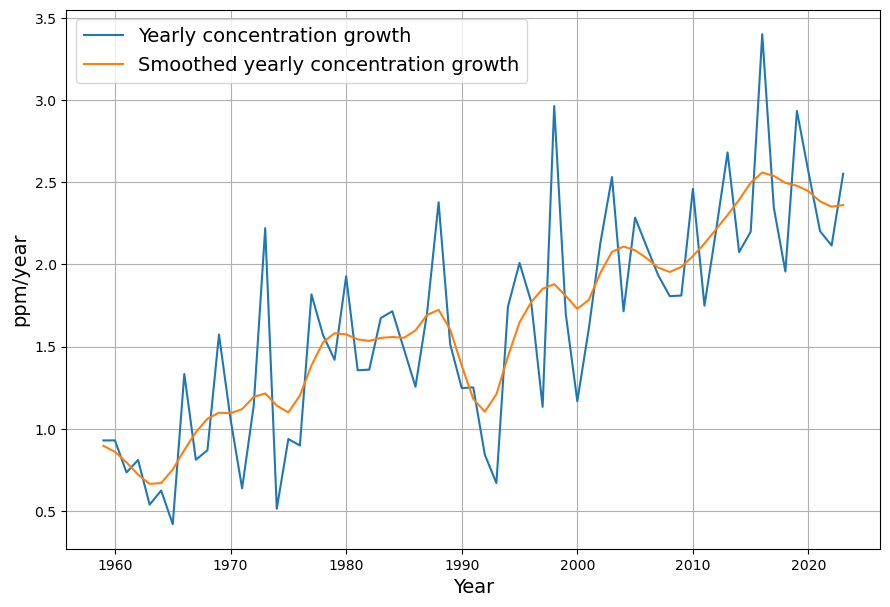
This confirms that until 2016 there was a clear trend towards ever higher annual concentration increases, from just under 0.75 ppm/year in 1960 to over 2.5 ppm/year in 2016.
Since 2016, however, the annual increase has been declining, initially slightly, but significantly more strongly in 2020 and 2021. The corona-related decline in emissions certainly plays a role here, but this does not explain the decline that began in 2016.
There is therefore an undisputed turning point in the concentration curve in 2016, i.e. a trend reversal from increasing concentration growth to decreasing concentration growth. Is there a satisfactory explanation for this? This is essential, because if we can foresee that the trend of decreasing concentration growth will continue, then it is foreseeable that the concentration will stop increasing at some point and the goal of the Paris Climate Agreement, the balance between CO2 sources and CO2 sinks, can be achieved in the foreseeable future.
Explanation due to stagnating emissions
As part of the Global Carbon Brief project, Zeke Hausfather 2021 revised the values of global CO2 emissions over the last 20 years based on new findings, with the important result that global emissions have been constant for 10 years within the limits of measurement accuracy:
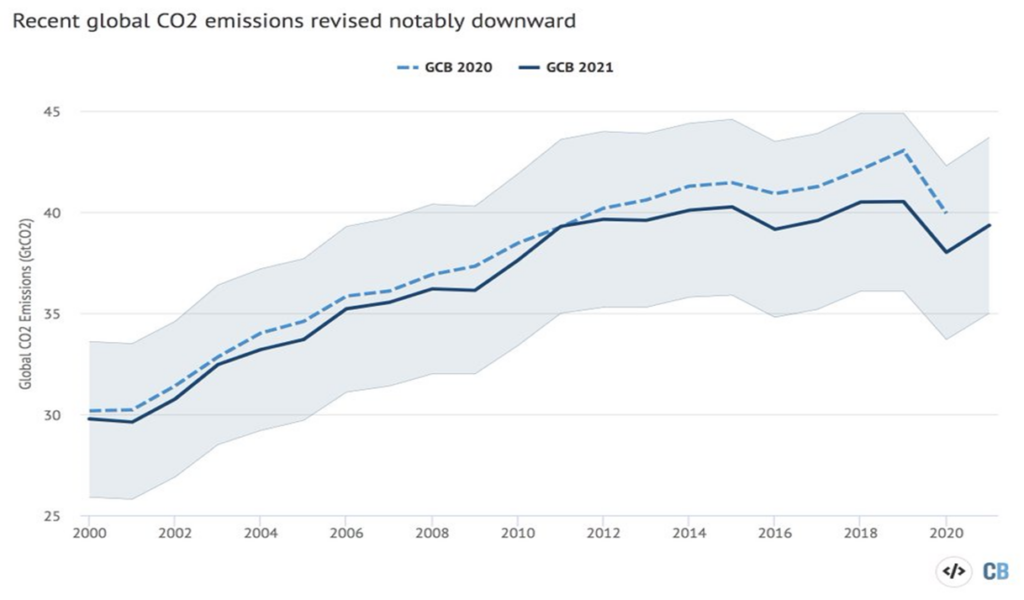
To assess the implications of this important finding, one needs to know the relationship between emissions and CO2 concentration.
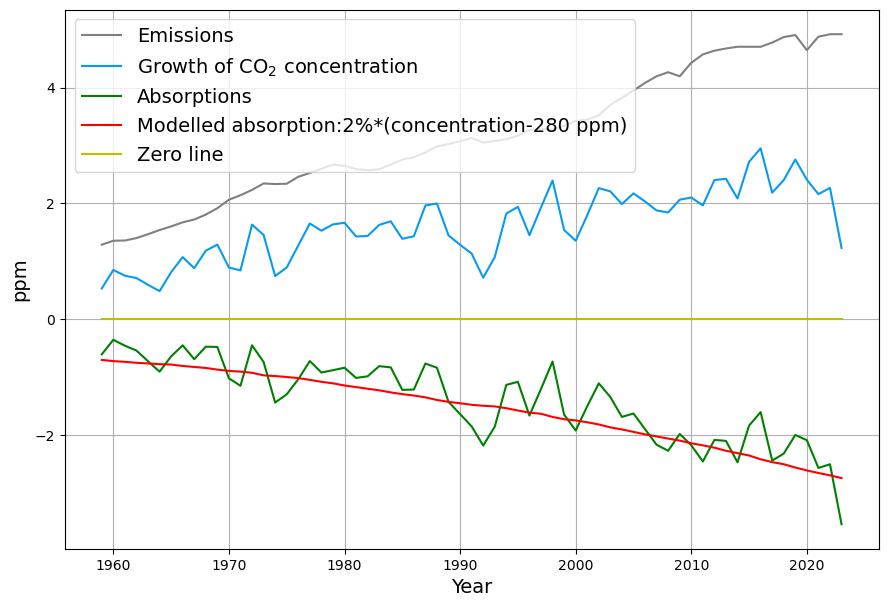
From my own research on this in a publication and in a subsequent blog post, it follows that the increase in concentration results from the emissions and absorptions, which are proportional to the CO2 concentration.
This model has also been described and published in a similar form by others:
- Prof. Vollmer and Prof. Eberhardt A simple model for the prediction of CO2 concentrations in the atmosphere, depending on global CO2 emissions
- Prof Ganteför in several videos, e.g. here,
- Prof Vahrenholt, in the publication “Oceans’ surface pH-value as an example of a reversible natural response to an anthropogenic perturbation“,
- Dr Roy Spencer in the blog publication “A Simple Model of the Atmospheric CO2 Budget“,
- Ari Halparin in the blog publication “Simple Equation of Multi-Decadal Atmospheric Carbon Concentration Change“,
- Peter Dietze in the blog publication “DECARBONISATION? The fatal error caused by false carbon models“.
Trivially, it follows from the conservation of mass that the concentration  at the end of the year
  results from the concentration of the previous year
  , the natural emissions
  , the anthropogenic emissions
  and the absorptions
  :
:
(1) 
(2) 

and the linear model assumption, i.e. that the absorptions are proportional to the concentration of the previous year,

the absorption model is created (these two assumptions are explained in detail in the publication above), where
 :
: (3) 
 and
and  . In this calculation, emissions due to land use changes are not taken into account. This explains the numerical differences between the result and those of the cited publications. The omission of land-use changes is justified by the fact that in this way natural emissions lead to the pre-industrial equilibrium concentration of 280 ppm.
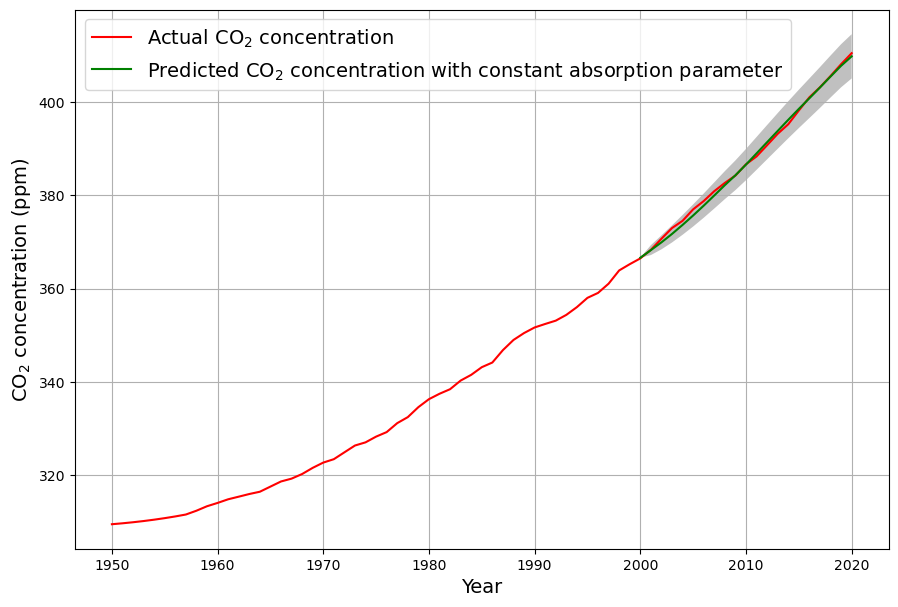
With this model, the known concentration between 2000 and 2020 is projected very accurately from the data between 1950-2000:
Growth rate of the modelled concentration
The growth rate of the modelled concentration  is obtained by converting the model equation:
This no longer shows the cyclical fluctuations caused by El Nino:
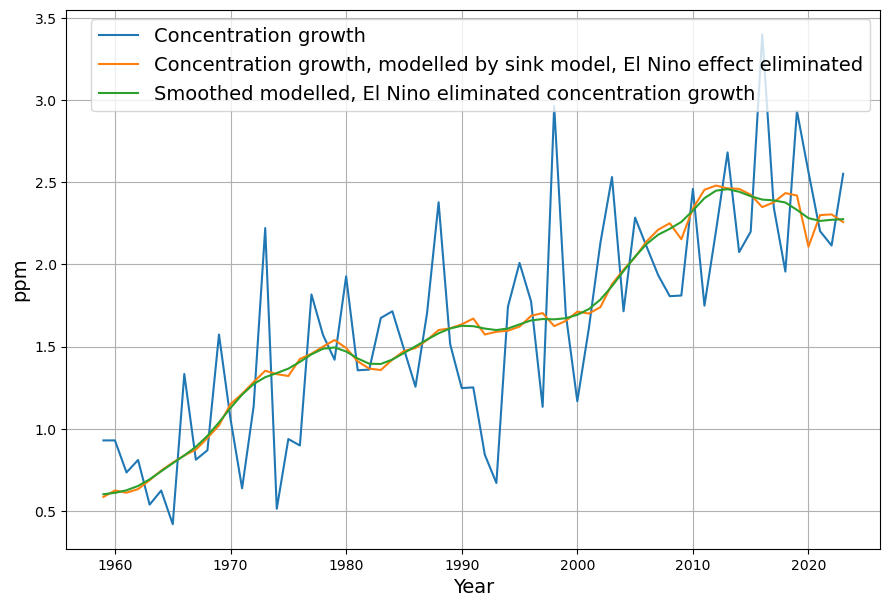
The global maximum remains, but the year of the maximum has moved from 2016 to 2013.
These El Nino-adjusted concentration changes confirm Zeke Hausfather’s statement that emissions have indeed been constant for 10 years.
Evolution of CO2 concentration at constant emissions
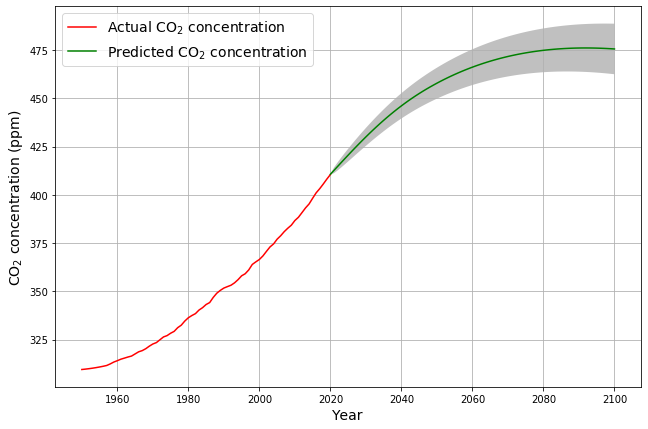
In order to understand the inflection point of the CO2 concentration, we want to calculate the predicted course with the assumption of constant emissions  and the equations (2) and (3):
(4) 
is subtracted from the constant emissions  , which means that the increase in concentration decreases with increasing concentration. This can be illustrated with a special bank account. As soon as the concentration reaches the value
  , the equilibrium state is reached in which the concentration no longer increases, i.e. the often used “net zero” situation. With current emissions of 4.7 ppm, “net zero” would be at 515 ppm, while the “Stated Policies” emissions scenario of the International Energy Agency (IEA), which envisages a slight reduction in the future, reaches equilibrium at 475 ppm, as described in the publication above. According to the IEA’s forecast data, this will probably be the case in 2080:
According to this, constant emissions are sufficient justification for a convex course of CO2 concentrations, as we have seen since 2016. At the same time, this proves that CO2 absorption does indeed increase with increasing concentration.