 by
by 
There are two parts of the climate discussion:
- The sensitivity of the temperature w.r.t. the atmospheric
 content
 - The amount of in the atmosphere
While the sensitivity dominates the scientific climate discussion, the political decisions are dominated by “carbon budget” criteria on the basis of numbers, which are hardly publicly discussed.
It has been claimed that more that 20% of the emitted will remain in the atmosphere for more than 1000 years.
This article will investigate the functional relation between emissions and the actual content in the atmosphere.
Atfter finding this relation several future emission scenarios and their effect on the atmospheric content are investigated.
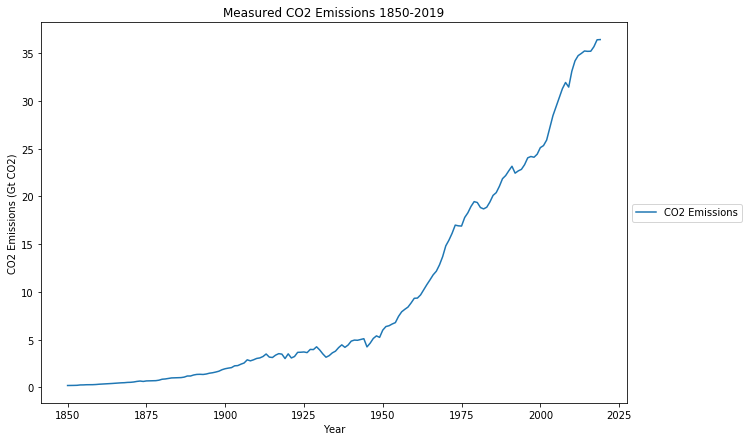
Carbon dioxid emissions in the past
Starting point are the actual emissions during the last 170 years
It is very informative to look at the relative changes of this time series (here the mathematical derivation). This is the equivalent of economic growth for emissions.
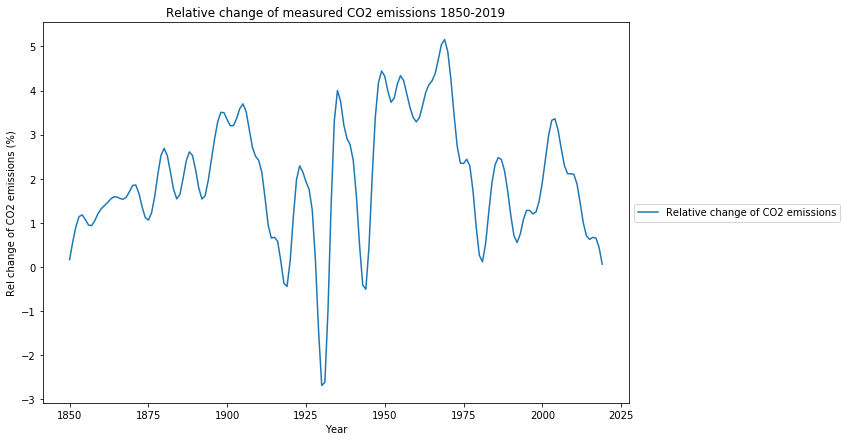
The largest increase in emissions was between 1945 and 1980, the period of great growth in wealth and quality of life primarily in the industrialized countries, with the absolute peak of global emissions growth passed in 1970, interestingly 3 years before the first oil crisis. At the turn of the millennium, there was another increase in emissions, this time caused by the economic boom of the emerging economies. Since 2003, the growth of emissions has been steadily declining, and has de facto already fallen below the zero line, i.e. from now on, emissions are not expected to grow, despite the growth in China, India and other emerging and developing countries.
This is convincingly illustrated in the time-series graph of the Global Carbon Project:
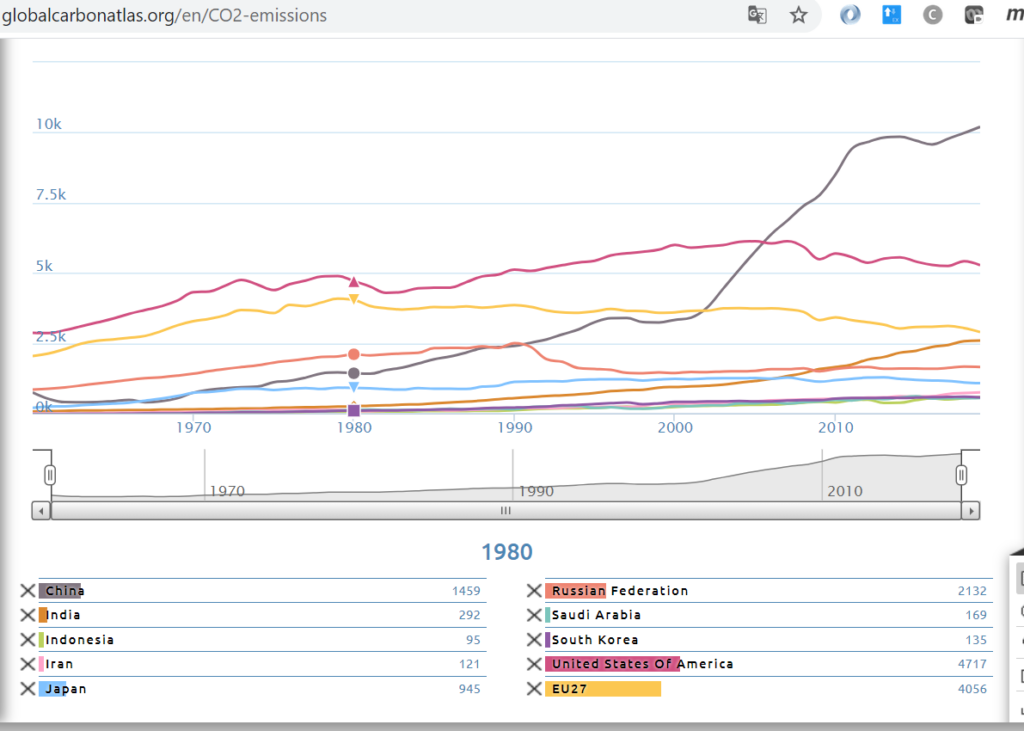
The long-standing decline in emissions in industrialized countries is currently balancing out with the slowing rise in emerging economies China and India since 2010.
Accordingly, it is realistic to call constant emissions from 2019 onward “business as usual”. While 2020 was a Covid-19 driven emissions decline, the rebound in 2021 is expected to remain 1.2% below the 2019 level.
CO2 content of the atmosphere with simple emission models
It is assumed that before 1850 the level was approximately constant and that the measured content is the sum of the pre-industrial constant level and a function of the emissions. The aim of this chapter is to find a simple function, which explains the atmospheric content.
Three different models are tested:
- The first model assumes that all emissions will remain in the atmosphere forever. This means that the additional – on top of the pre-industrial leval – content would be the cumulative sum of all -emissions.
- The second model assumes an exponential decay of emitted into the oceans or biosphere with a half life time of 70 years, i.e. half of all emitted is absorbed after 70 years. This is achieved by a convolution with an exponential decay kernel and a time constant
 years
years - The third model assumes an exponential decay of emitted into the oceans or biosphere with a half life time of 35 years, i.e. half of all emitted is absorbed after 35 years. This is achieved by a convolution with an exponential decay kernel and a time constant
 years.
In order to make the numbers comparable, the emissions, that are measured in Gt have to be converted to ppm. This is done with the equivalence of 3210 Gt = 410 ppm .
The yellow graph are the measured actual emissions from the diagram above, and the blue graph is the measured actual content.
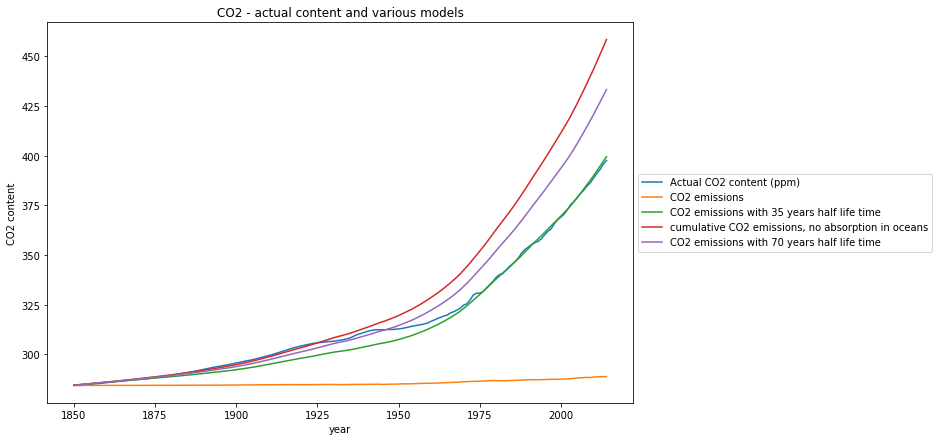
The first “cumulative” model approximates the measured content quite well from 1850 to 1910, but heavily overpredicts the content after 1950. This falsifies the hypothesis that stays in the atmosphere for “thousands of years”.
Also the second model model with a half life time of 70 years of emitted overshoots considerably after 1950, it approximates the time between 1925 and 1945. The third model with a half life time for emissions of 35 year fits the actual content from 1975 till now.
This confirms, what has very recently been published in Nature , that the rate of absorption into the oceans increases with increasing atmospheric content.
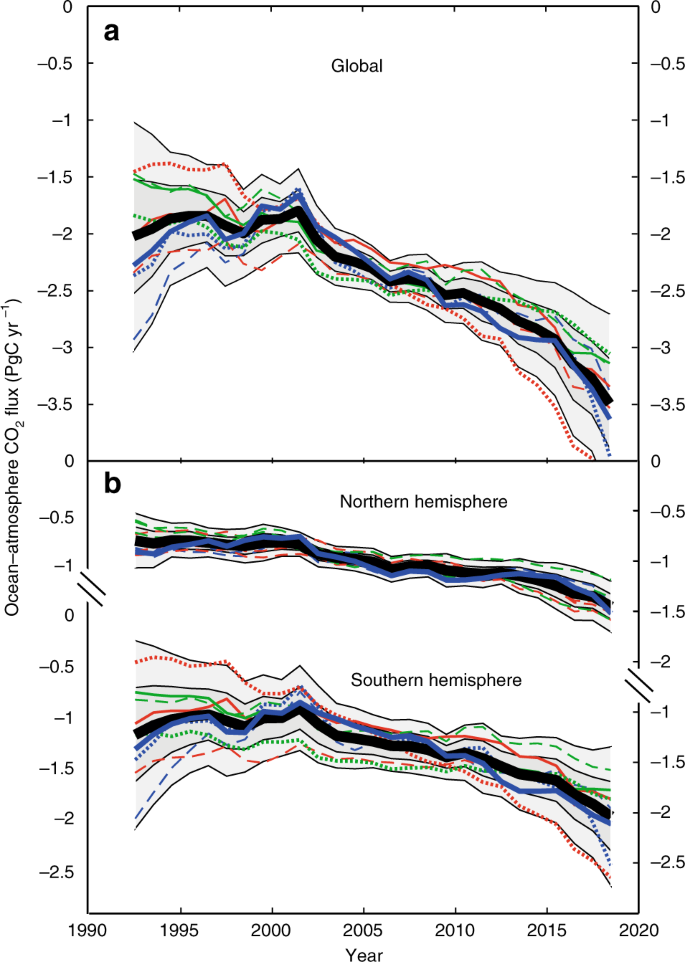
The same relation, in particular the increasing “carbon sink” of oceans and biosphere, is reported from the Global Carbon Project in this graphics:

Although we can expect a further increase of the flux into the ocean in the future, we can therefore safely use the third model with a half life time of 35 years for conservative, i.e. non-optimistic predictions.
Future scenarios
In order to evaluate policy decisions, I will apply this model to predict the future content with 3 different emission scenarios:
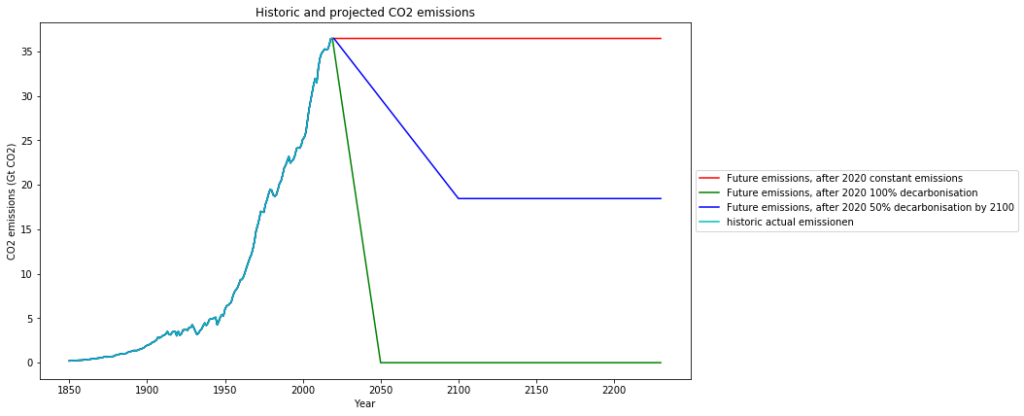
- The first scenario (red) I’d like to call the “Business as usual” scenario, in the sense that China already now increases emissions only marginally and has committed itself to stop increasing emissions after 2030. Today emissions are not growing any more. This scenario means, that we keep global emission on the 2019 level.
- The second scenario (green) is the widely proclaimed decarbonisation by 2050
- The third scenario (blue) is a compromise proposal, reducing emissions to 50% of the 2019 value (37 Gt) by 2100. This scenario reflects the facts that fossil fuels are finite, and that research and development of sound new technologies takes time:
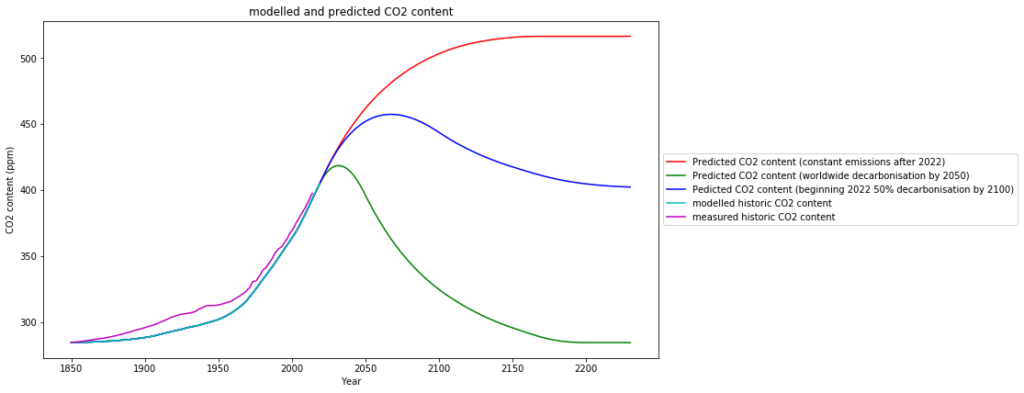
The consequences for the -content based on the simple model with 35 years half life time are these:
- The first scenario (red) increases content, but not beyond 510ppm in the long distant future, which is less double the amount of the pre-industrial era. Depending on the sensitivity this means a hypothetical induced temperature increase of 0,16° to 0,8° from current temperatures, resp. 0,45° to 1,3° since pre-industrial times, depending on the sensitivity.
- The second scenario — worldwide fast decarbonisation — (green) hardly increases the content any more, and eventually reduces the atmospheric content to pre-industrial levels.
Do we really want this??? This would mean deprivation of all plants, which thrive best at-levels larger that 400 ppm. Not even the IPCC ever formulated this as a desirable goal. - The compromise scenario (blue) will slightly raise content but keep it below 460 ppm, and then gradually reduce it to the 1990 level. The atmospheric levels will begin to fall after 2065.
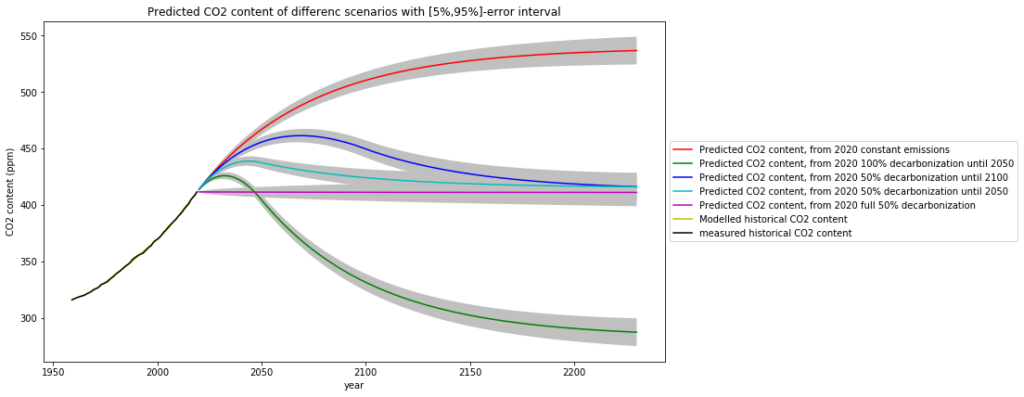
 content prediction based on simple model with 35 years half life time.
A rigorous mathematical model based on the the single simple assumption that oceanic and biological absorption is proportional to concentration comes to essentially the same result, with the nice side effect to have an error estimate of the prediction:
Conclusion
Not even the most pessimistic of the scenarios described above reaches a “catastrophic” content in the atmosphere.
The complete decarbonisation scenario by 2050 can only be judged as utter nonsense. No one can wish to go back to pre-industrial levels.
On the other hand, the limited fossile resources motivate to replace them in a feasible and humane way. This is reflected in the “compromise” scenario, which gradually reduces long-term emissions to the level of approximately the year 1990.