by
by 
Relevant data analysis crucially depends on the availability of reliable data. Historically it has been of utmost importance to have temperature data that are as precise as possible, because this is one of the essential predictors for the expected weather. Also the long term monitoring of climate and climate trends requires maximum quality temperature data.
What, if people and institutions started messing with such data, because the data as they actually are, do not fit to a given political agenda? This would invalidate – at least partially – the conclusions that we draw from these observations.
Unfortunately exactly such a deliberate tampering of temperature data actually happened. One of the milestones of the events is a paper from James Hansen “GISS analysis of surface temperature change”. In this paper Hansen describes a number of necessary adjustments that — in typically rare cases — need to be made to temperature data in order to make the temperature anomaly averaging consistent:
- The most common adjustment is the correction for the urban heat island effect. Typically this is a consequence of urban growth: In the past the thermometer was outside of a town in a green environment, with the growth of the town it is now surrounded by houses and subject to the urban heat effect, which raises the temperature. In order to make this consistent with the previous measurement, either the past temperatures must be raised or the future temperatures must be lowered. It is usually easier to adjust the past temperature, pretending that the city was always as large as today. It is questionable, whether such an adaptation is justified, or whether it would be wiser to track the urban heat effect explicitely and not change actual measurements of the past. Fact is that a change in past temperatures changes also the global mean temperature which is not justified under any circumstances.
- A second – understandable – situation to adapt temperature data occurs, when a thermometer location is moved to higher or lower altitude. E.g. in the case of a downhill altitude change of 160m this would correspond with a temperature increase of the past data by 1° C, with an assumed adiabatic lapse rate of -6°/km . The physical meaning of this is the invariance of potential temperature when the energy content of the whole system is not changed. In my judgement this is the only legitimate adaptation to temperature measurements, because it doesn’t change the original true measurement, but maps it to another location, where no measurement had been made previously.
Both these adapatations have been justified in Hansen’s paper. It must be noted that the dominant case of urban heat islands would lead to an increase of past temperatures, or a decrease of current and future temperatures.
The time series of US mean temperatures have been published by Hansen on p. 47 of his paper (bottom left corner of the page):
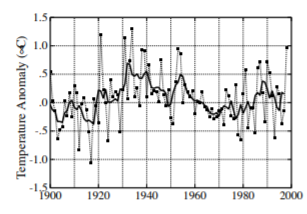
It can clearly be seen that the 3 highest temperatures in the 20th century were in 1934, 1921, and 1931. Also the moving average has its peak clearly in the early 1930s, and a downward trend from the 30s to the end of the century.
When we look at today’s temperature data, which are available online from NOAA, we are surprised to see this:
Looking carefully at the diagram, one can observe that now the 1998 temperature is larger than the previously largest 1934 temperature, and quite a few of the later 20th century temperatures have been increased while reducing the earlier data. This is exactly the opposite of what one would expect from an urban heat island correction.
I have been made aware of this problem, which in my understandig can only be interpreted as willful manipulation, by a video of Tony Heller.
Detailled data analysis by Prof. Friedrich Ewert
The fact that the NASA/NOAA temperature data have been manipulated, has been carefully analyzed and evaluated by Prof. Friedrich Ewert. He found out in a tedious analysis that many temperature data before 2010 have been changed by 2012. With today’s data sets the original data from before 2010 cannot be found any more. Prof. Ewert was able to make the comparions, because he had archived the earlier data sets.
The manipulations are not only on US temperature data, but also on data of other countries. For the 120 randomly selected stations, Ewert recorded the tens of thousands of individual data given by NASA for each year before and after 2010. To print out his data would result in a list 6 meters long. It can be seen that ten different methods were used to produce the climate warming. They are all documented in the study with examples. 6 of the 10 examples were applied most frequently:
- A lowering of the annual mean values in the initial phase.
- A reduction of individual higher values in the first warm phase.
- An increase of individual values in the second warm phase.
- A suppression of the second cooling phase beginning around 1995.
- A shortening of the data series by the earlier decades.
- For long-term series, the data series were even shortened by the early centuries.
The Climategate Emails
The leaked “Climategate Emails”, which became public in 2009, provide further evidence that deliberate temperature data tampering was not a conspiracy theory, but a real conspiracy between multiple institutions and persons from at least the US and Great Britain, carefully investigated by Stephen McIntyre and Ross McKitrick, who in 2009 debunked and uncovered the deception of Michael Mann’s “hockey stick” in their paper “Proxy inconsistency and other problems in millennial paleoclimate reconstructions”.
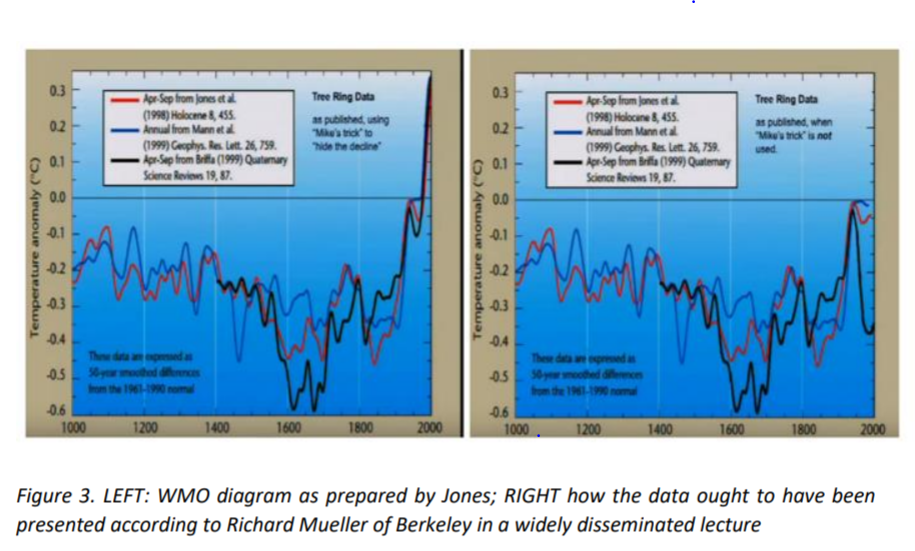
The most famous example of the deliberate temperature manipulation has been expressed by Phil Jones of the British Met office in an email to Michael Mann and .. Briffa:
“I’ve just completed Mike’s Nature trick of adding in the real temps to each
series for the last 20 years (ie from 1981 onwards) and from 1961 for Keith’s
to hide the decline.”
Here the diagram from the dossier by Stephen McIntyre and Ross McKitrick: