 by
by 
Solar energy is considered to be emitting no  , the true solution to the desire to build a carbon free energy supply. This directs the focus of attenation to the “active” life of PV production, which appears to produce “free” energy, free of cost and free of .
This focus changes when you actually plan to install photovoltaic supply for e.g. a private home. This requires quite a lot of costly components, costly not only in terms of price, but also in terms of energy:
- The solar panals and (thick high current) cables
- the inverter module,
- backup batteries to at least bridge the day/night volatility
In particular the solar panels and Li-Ion batteries require a lot of energy and other resources. Being required in large quantity due to the low energy density and volatility of sunlight, for a complete calculation of energy budget and carbon footprint the costs of production must be taken into account.
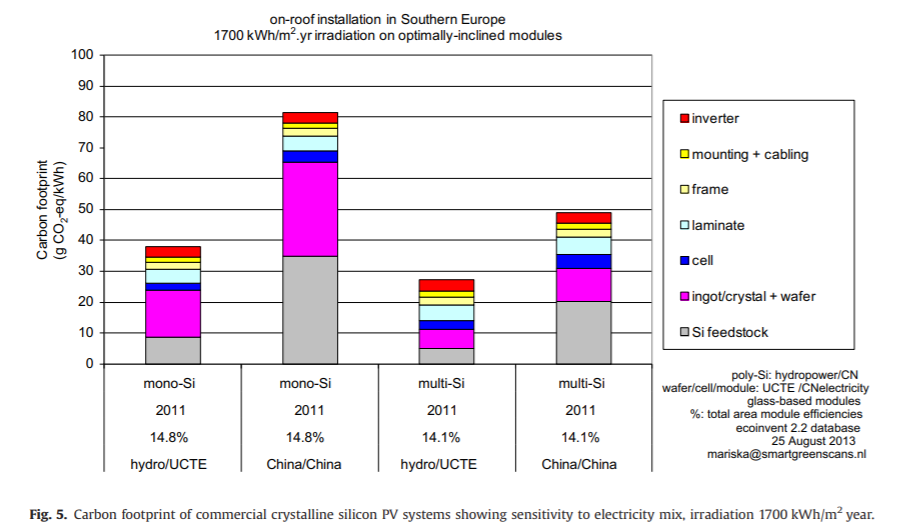
We investigate the carbon footprint of a system that does not depend on fossil fuels. In 2013 Mariska de Wild-Scholten has investigated this in the publication “Energy payback time and carbon footprint of commercial photovoltaic systems“. This will be used as a basis in this analysis.
Most assumptions for the calculations appear to be fair and realistic. Two of them I want to look at more closely:
- Energy output is assumed 1275 kWh/a per installed
 module size,
 - Life time is assumed to be 30 years
Taking the real Energy output from Germany, based on the official statistics from the Fraunhofer Institute, the total produced volatile energy 2020 from  installed solar modules was
  , which is an average real energy output of
  for each installed module. The assumptions in the paper explicitely state that they are valid for southern Europe, so there is no intentional bias, but the numbers are just not valid for e.g. Germany and other central European countries.
The life time assumption is also very optimistic. Taking into account that there may be damage to the modules due to thunderstorms, hail storms, or defects in the solar cells, it is more reasonable to assume a life time which is identical to the guaranteed product life time, which is typically 25 years.
Most PV modules are produced in China, so regarding the emissions, the base number for the carbon footprint is

Taking into account the real solar energy delivery, and the more realistic, insurance validated life expectancy of 25 years, the real PV carbon footprint for Central Europe, represented by the statistics of Germany, is

Including Short term storage
Due to the volatile character of solar energy the actual power generation is not yet the end of the story, when the goal is an energy production without fossil fuels. The first type of volatility is the day/night cycle and short term weather variations. This type of volatility can be covered with a 1-7 day battery storage. A reasonably safe value is a storage equivalent to 3.5 day energy consumption, which covers appr. 7 days, assuming half the consumption is during the – solar active – day time. With this scenario chances are good to cover nearly the whole time range from march to October. This is more capacity than is typically bought currently in Germany, but the political enouragement of storage is just beginning. In the US there are more fully autonomous “island” installations, which usually have even larger battery stores.
Therefore as a rule of thumb the battery capacity is assumed to have 1% of the yearly expected energy yield to cover most requirements except the 3-4 winter months. This is documented by practical experiences. For each installed module with 1  the required capacity C is
The carbon footprint for Li-Ion batteries is appr. 75 kg per kWh Storage capacity – it is assumed that it is the same for EVs as for power wall usage, and the guaranteed life time is 10 years, although there are — not guaranteed — claims of 20 year lifetime. In order to estimate conservatively, we assume 10 years of lifetime, considering the fact that the battery capacity cannot be used 100% . Extending the life time of a battery typically means to reduce the active capacity by 30-50%. The calculations can be adapted for 15 or 20 years, when new generations of batteries will be available. Therefore the storage carbon footprint per installed module is distributed on the total energy production of 10 years:
Therefore a feasible standard installation for private homes, essentially the electric energy supply for 8 months from march to october implies a total carbon footprint of  .
.
Long term storage – through the winter
There are several ways to estimate the carbon footprint effect of seasonal volatility, i.e. that in winter there is hardly any usable solar insolation whereas in summer there is a peak. Assuming that the yearly total solar energy generation corresponds to the yearly total consumption, it is obvious that the seasonal volatility, which leads to the deficit in winter, means a surplus during the summer months.
Following the analysis of Prof. Hans-Werner Sinn, the main storage problem is not the short term storage, but the long term storage. Solving the problem with solar energy alone along the lines discussed above, we have to add at least 3 additional months of storage, as there is hardly any solar energy between mid november to mid february – this is dependent on latitude, the statement is made for appr. 50 degrees (Germany). There is unanimous consent that this longterm storage not possible by means of Li-Ion batteries, neither from a price perspective nor from a carbon footprint perspective.
Local longterm solution – solar energy only
The currently favoured approach to long term storage is the so-called Power-to-Gas concept: The surplus electrical energy in the summer is converted to Hydrogen by electrolysis. Due to the fact that hydrogen is difficult to store and handle, it is further processed to methane (the calculations for the currently discussed alternatives ammonia or methanol are similar). This is identical to natural gas and can be easily stored (e.g. in liquid form as LNG) and reconverted to electricity with a gas power plant. This can be done at the scale of the community, city, county, or state, where both the electrolyser and the gas power plants are run.
The problem of this concept is that the effective storage efficiency is only 25%. In order to get 1 kWh in a winter month you have to invest 4 kWh during the rest of the year. 1 kWh of average yearly consumptions costs 
of volatile input solar energy. This increases the total carbon footprint to 
This is nearly half of the carbon footprint of a traditional gas power station, and cannot be neglected.
If we consider only the winter months, the solar P2G process has 4 times the carbon footprint, so  . This is almost the same as that of a normal gas-fired power plant (436-549
  , see also here ) . Accordingly, it is irrelevant for the balance whether the electricity needed in winter is generated from fossil natural gas or via solar-powered power-to-gas processes. The price of methane produced with power-to-gas, however, is about 10 times that of fossil natural gas.
If it is possible to store hydrogen directly without extremely high pressure or extreme cold, then the efficiency of storage can be increased to 50%, resulting in a footprint of at least  , this is without taking into account generation for storage (e.g. construction of the plant).
Large scale longterm solution – including wind energy
In his analysis Prof. Sinn took into account that solar energy is not the only “regenerative” source, but also wind, and that the availability of wind is partially complementary to the solar power. The result of his calculations was that the total storage requirment for smoothing the seasonal volatility (essentially the problem of winter) would be 11 TWh based on the total electricity consumption in 2014 of 163 TWh, approximately 6.7% of that total electricity consumption. Due to the fact of large yearly changes, a safety margin requires at least 7 to 7.5%, provided one insists on a 100% fossil fuel free supply.

This would mean a minimum longterm energy overhead factor for a power-to-gas storage of
and a total carbon footprint of 
The carbon footprint of wind power energy generation is not treated explicitely here, which means that it is implicitely assumed to be the same as of solar PV generation. For the original question of private household electricity supply it plays a minor role, it is only relevant as a regenerative partial provider during winter time.
Consequences for Electric vehicles
In the current political understanding in the EU, electric vehicles are by definition considered to be carbon neutral. There are, however, serious discussions about the true carbon footprint of EVs compared to e.g. Diesel cars, emerging from a study of Prof. Hans-Werner Sinn et al. Their analysis, which states that the carbon footprint is higher than a comparable Diesel car, is based on the current electricity mix of the German grid. Based on their sources the carbon footprint of a 75 kWh car battery is at least 73  , possibly up to 98 . Indeed if is an active greenhouse gas, it doesn’t care about a political tabu.
The consumption realisitically is considered to be 15 kWh per 100 km. Therefore the carbon footprint of battery and solar based consumption is (this ignores the carbon footprint to build the car) optimally
This is considerably higher than the 2020 EU limit of 95 and more than 50% above the 2025 limit of 70 .
Why are there double standards in politics and among the authorities? For nature it is irrelevant on which way the gets into the atmosphere. Politically it is more honest to let the into the own airspace with a gasoline or diesel vehicle, than to keep the own air allegedly “clean” by -colonialism, shifting the emissions to China or other “cheap countries” by means of the production of the necessary components.
I think a bigger objection to solar power when widely installed would be the fact that it reduces albedo and deposits most of the collected (and wasted) energy at the bottom of the atmosphere.
Although it may still be insignificant compared to the 127 T Watt the Sun delivers to the Earth.
A more concerning issue is the reduction of albedo by attempts to prevent desertification (vegetation usually has lower albedo) and cleaning of air.