by
by 
It is well known that so-called “renewables,” i.e., wind power and photovoltaics, only supply energy intermittently. In Germany, photovoltaics average 800-900 full-load hours per year, onshore wind power between 1800 and 2000 full-load hours, and offshore wind power around 3300-3500 full-load hours. However, the year has an average of 8766 hours (8760, 8784 in leap years), which means that many times the so-called nominal output is required to supply at least the average amount of energy required.
A brief digression on the problem of grid expansion
This already makes it clear why the energy transition has a notorious problem with the existing power grid, even though it was completely sufficient to meet demand with conventional power plants and there was enough reserve capacity. When generating with renewables, the grid must be expanded, at least in parts, for full nominal power, but the actual average yield is at most 20% of this, which means that parts of the grid must be oversized by up to a factor of 5. This problem is currently evident in the fact that there is a “backlog” in the approval of large battery storage facilities, because large grid capacities must also be reserved for these storage facilities “on suspicion,” which are then only actually used for a fraction of the time.
These massive problems, which are solvable in principle but entail enormous costs, are currently dominating much of the political debate. It is being claimed that the expansion of the grids will solve the main problem of the energy transition. However, this is not the case.
For this reason, all of the grid problems mentioned are considered to be solved in the following considerations. We are acting as if we had ideal grid conditions. The electricity generated in the North Sea is hypothetically available without restriction in Berchtesgaden. Battery storage facilities are to be connectable without limitation.
In order to show that the concept of the energy transition, which aims to “smooth out” volatile energy with storage facilities, has fundamental problems, we must assume ideal conditions so as not to get bogged down in the actual problems in advance.
Planned expansion of the energy transition in 2030
Depending on the expansion of wind and solar power, there will be times of deficit and times of surplus.
However, the energy transition is designed so that ultimately the entire supply will come from renewable energies. According to the plans of those responsible for the energy transition, the majority of electrical energy requirements are to be covered by renewables by 2030 through the rapid expansion of photovoltaics and wind power. According to the study “Climate-neutral Germany 2045,” which forms the basis for the energy transition[1] , this is to be achieved through the expansion of photovoltaics and wind power as follows:
- Installed photovoltaic capacity 198 GW (2023: 76 GW)
- Installed onshore wind capacity 93 GW (2023: 59 GW)
- Installed offshore wind capacity: 27 GW (2023: 8 GW)
The total planned installed capacity is therefore 318 GW.
It is also assumed that the total annual load will increase from 458 TWh in 2023 to 656 TWh in 2030. This load is used as a reference for the percentages used.
Simulation of the 2030 energy transition scenario[2]
What does this expansion mean for the German electricity supply in 2030? To answer this and other questions, Dr. Björn Peters and I conducted a study in which the expansion scenarios for the energy transition were subjected to a reality check[3] : We extrapolated the actual, quarter-hourly energy generation from photovoltaics, onshore wind, and offshore wind from 2023 or, optionally, 2024 to 2030 using the respective expansion factors, as well as the extrapolated consumption load for the selected reference year. The calculations here use the data set from 2023.
Furthermore, the energy generated from hydropower was taken unchanged, which corresponds to an annual yield of 19 TWh (3% of the annual load). Energy generation from biomass was assumed to be constant at 7 GW (9% of the annual load), which represents a slight assumed increase from the current average of 5.4 GW.
Since this study aims to explore the optimal possibilities for battery storage, the non-adjustable base load is limited to purely renewable sources such as hydropower and biomass. Adjustable backup power plants cannot yet be completely dispensed with in the 2030 expansion. In order to guarantee an overall surplus, 8 GW of adjustable power plant capacity is planned. However, this largely dispenses with the instantaneous reserve, which is a prerequisite for grid stability. With this extremely optimistic scenario, 66% of the annual load is covered by direct use of renewable energies. Together with hydropower and biomass, this amounts to 78%. The backup power plants come first in the processing order of the scenario and are therefore independent of the storage size. The backup power plants generate 5% of the annual load.
Another controllable reserve is provided by potential electricity imports. These are assumed to be a maximum of 5 GW, which is about twice as high as the actual electricity imports in 2024. Likewise, a potential electricity export of 5 GW at any time is assumed. In the given scenario, imports then contribute 3% to covering the total load. Both the maximum import and the maximum export can be changed as desired in the simulation program[4] .
Under these conditions, the extent to which Germany can be supplied by renewables and battery storage is examined. With these conditions, 14% of the total load must still be provided by storage.
First, Fig. 1 shows the surplus/deficit trend for the entire year. This is calculated by subtracting energy demand from energy supply every quarter hour. The energy supply consists of wind and solar energy as well as other renewable energies, hydropower, and biomass.
Initially, only the available pumped storage capacity of around 40 GWh is used for storage.
The blue curve shows the surpluses and deficits before storage, variable backup power plants, and electricity imports are used. Before the storage and backup process, the deficits predominate in the balance sheet, accounting for 22% of total consumption in the blue curve, while the surpluses initially account for 17% of total consumption.
The process applied to this includes (in this order) backup power plants, imports, storage, and exports.
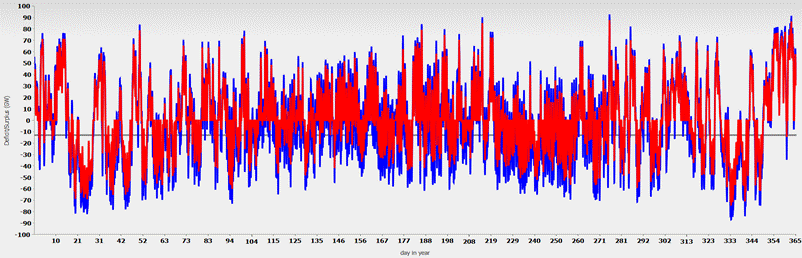
Fig. 1: Annual course of volatile electricity generation (blue) and after storage with pumped storage (red)
The red curve describes the discrepancy after this process. It is idealistically assumed that backup power plants can respond very quickly, i.e., within a quarter of an hour, to changes in demand. In reality, this is not always possible.
The gray line shows the maximum possible control power of the backup power plants and electricity imports. With the selected backup and import values, this is 8+5 GW = 13 GW.
For better illustration, Fig. 2 shows the month of September selected and enlarged:
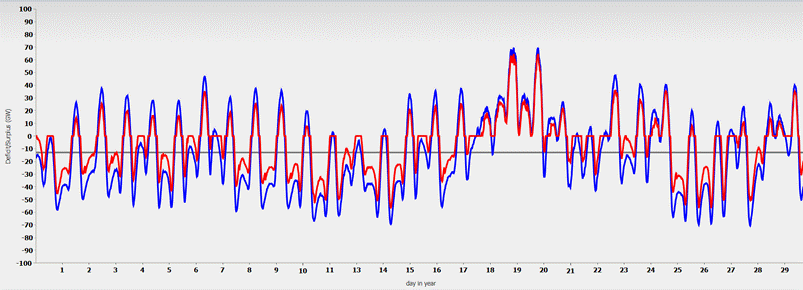
Fig. 2: Course of volatile electricity generation (blue) and after storage with pumped storage in the month of September.
Fig. 3 shows the state of charge of the (pumped) storage facility:
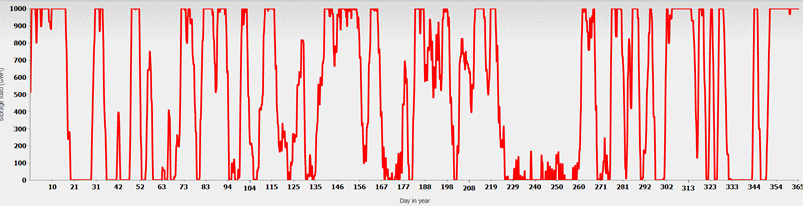
Fig. 3: Charge status of the pumped storage reservoir over the course of September
On the first day, the storage facility is empty and there is an electricity deficit that cannot be offset by the process involving storage, backup, and imports. By the 11th day, the storage facility is almost full every day, but it is still not enough to cover the load. Only from the 18th day onwards is the demand covered for 3 days. The export of 5 GW ensures that the red curve lies slightly below the blue curve and that a maximum of 5 GW can flow abroad.
Over the course of the year, storage reduces the original 17% surplus to 14%. The deficit falls from the original 22% to 13%. This significant reduction is not solely due to storage, but also to the use of backup power plants and electricity imports. In any case, after the process, the surplus is greater than the deficit, which is a favorable condition for the use of battery storage.
With the minimal storage expansion of the existing pumped storage power plants, it is therefore not possible to store the surpluses or compensate for the periods of deficit.
Use of battery storage
Batteries – that’s the current hype that is supposed to solve the problems caused by volatile renewables. The plan is to store the surpluses that currently lead to negative prices so that they are available at night or during periods of calm. When it comes to discussions about the problems of volatility, the unanimous answer is that all this will be solved by large battery storage systems.
The official plan is to have battery storage with a capacity of 300 GWh in use by 2030, in addition to the existing 40 GWh of pumped storage. See Fig. 4 for a diagram of volatile generation.
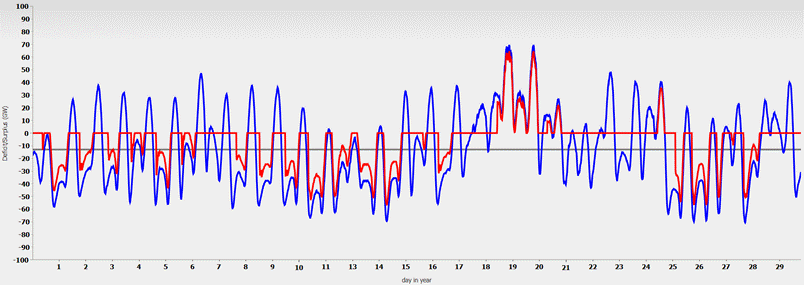
Fig. 4: Volatile electricity generation (blue) and after storage with 300 GWh battery storage (red) in September
See Fig. 5 for the fill level of the battery storage facilities (excluding pumped storage).
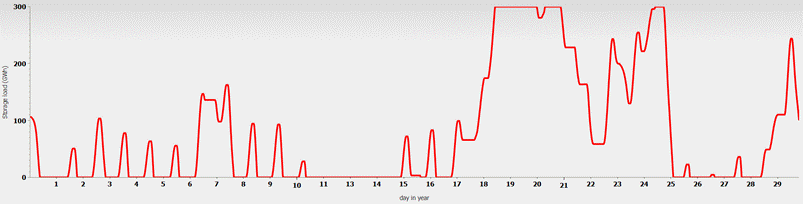
Fig. 5: Fill level of the battery storage facility with a capacity of 300 GWh in September.
The result of the drastic increase in storage capacity is somewhat disappointing. Most days on which there were electricity deficits without the battery storage facilities still have electricity deficits, albeit slightly smaller ones. At least there are only 4 days with surpluses after storage. Naturally, the larger storage facility can only have a positive effect where the previous pumped storage facility had reached its capacity limits, i.e., on days 18-24, on the 24th, and at the end of the month. Overall, the electricity deficit for the entire year is reduced to 10%, or around 66 TWh. The volatile annual surplus is still 11% (73 TWh), which must be disposed of through curtailment.
The fact that this is not a problem of a particularly “bad” month becomes apparent when choosing another month, e.g., December. Starting with an empty battery storage facility, there is initially an 8-day electricity deficit, with the following surplus days filling the storage facility on the first day. The surpluses from the following surplus days can therefore no longer be stored, and on the 11th day, the storage content is used up and the storage is empty again for a few days. From the 16th day onwards, the power supply is then sufficient for the rest of the month.
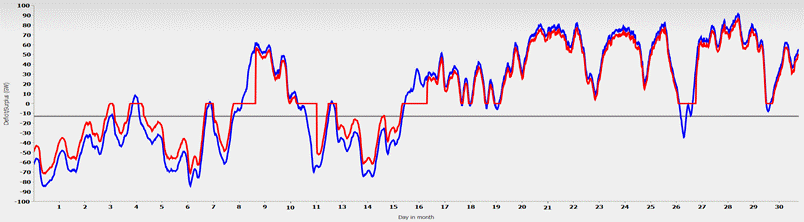
Fig. 6: Course of volatile electricity generation (blue) and after storage with 300 GWh battery storage (red) in December
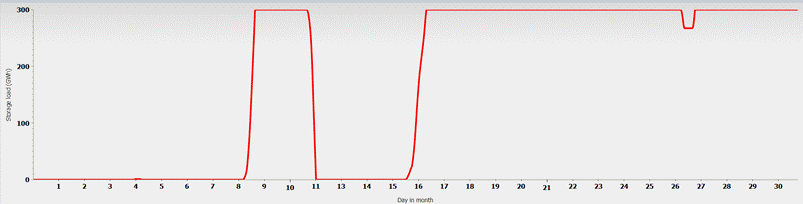
Fig. 7: Fill level of the battery storage system with a capacity of 300 GWh in September.
It should be noted that this storage expansion of 300 GWh already has an impact of an additional 1 ct/kWh on the average electricity price if the storage costs are allocated to total consumption. If only the electricity actually withdrawn from the battery is considered, the additional costs for storage are 33 ct/kWh. This price is calculated extremely tightly, assuming €200/kWh battery storage with a service life of 10 years, including operating and maintenance costs. These are pure purchase prices or cost prices. Today’s large-scale storage facilities are calculated at €400-800/kWh.
Hypothetical further expansion of battery storage
How will the picture change with further storage expansion? The scenarios discussed below are purely hypothetical; they are neither realistic in this form nor are they planned by the government. Their sole purpose here is to show how large the storage capacity must be in order to reasonably ensure the energy transition. And that the storage expansion planned to date completely ignores the problem of volatility. The fundamental considerations, in particular those relating to the expected storage capacity, also apply to other storage technologies not discussed here, such as hydrogen storage.
The next simulation is calculated with 1 TWh of battery storage.
The sobering result is that the deficit after the process is reduced to only 8% of the annual load, and the surplus is also 8% of the annual load.
According to Fig. 8, the storage facility often runs full over the course of the year and also runs completely empty again and again.
Fig. 8: Fill level of the battery storage facility with a capacity of 1 TWh over the course of the year.
Under these conditions, the battery storage surcharge on electricity costs would already increase to 3 ct/kWh, and the stored electricity alone would cost 58 ct/kWh. The price per kWh rises so sharply because the amount of energy stored does not increase at the same rate as the storage capacity. Additional storage is only useful if the existing storage reaches its capacity limits.
Even with an expansion to 10 TWh, there is still a deficit of 2%, or 13 TWh, but the
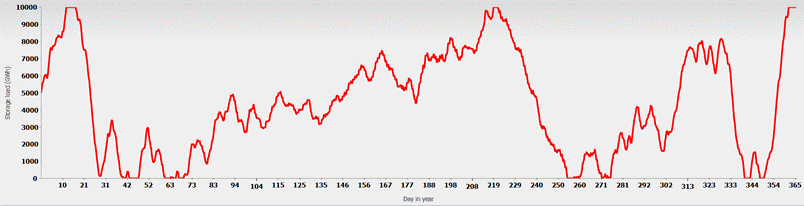
Fig. 9: Fill level of the battery storage facility with a capacity of 10 TWh over the course of the year.
storage levy to 30 ct/kWh. Fig. 9 shows the storage level over the course of the year. The storage facility only runs completely full twice a year, but still often runs completely empty.
Only at 30 TWh does the storage facility no longer run empty, as can be seen in Fig. 10, with a storage cost surcharge of 90 ct/kWh:
Fig. 10: Fill level of the battery storage facility with a capacity of 30 TWh over the course of the year.
However, this result only applies under the conditions of 2023. As is well known, wind and sun can vary greatly from year to year, so the success of this scenario is by no means a guarantee that it will also be successful in other years.
The boundary conditions of the scenario show that
- 66% of the load is supplied by direct processing of volatile renewable energies,
- 12% of the load will be supplied by hydropower and biomass,
- 8% of the load will be supplied by backup power plants and imports.
The remaining 14% must be obtained from storage facilities using surplus energy.
The following table summarizes the results of the storage simulations. The “Costs” column shows the costs for each kilowatt hour actually supplied. In the “Cost allocation” column, the battery costs are allocated to the total annual load, i.e., also to the electricity share from all other electricity sources that are not related to the storage system.
The CO₂ footprint of battery storage is calculated as follows: Manufacturing a battery generates 75 kg of CO₂ per kWh of battery capacity[5] . Assuming a service life of 10 years[6], this amounts to 7500 t/GWh per year. This is multiplied by the battery capacity and divided by the amount of energy withdrawn from the battery per year (analogous to the costs).
| Storage (GWh) | Yield share (% of load) | Surplus (%) | Deficit (%) | Costs (ct/kWh) | Cost allocation (ct/kWh) | CO2 Footprint (g/kWh) |
| 40 | 1 | 14 | 13 | 0.0 | 0 | 0 |
| 140 | 3 | 12 | 11 | 20 | 0.3 | 75 |
| 340 | 4 | 11 | 10 | 33 | 0.9 | 125 |
| 1040 | 6 | 8 | 8 | 58 | 3.0 | 218 |
| 10040 | 12 | 1 | 2 | 274 | 30.0 | 1027 |
| 30040 | 14 | 0 | 0 | 712 | 90.0 | 2668 |
The result is that the government’s planned expansion of battery storage (row marked in yellow, 300 GWh battery storage, 40 GWh pumped storage) will only be able to supply 4% of the total load, or 29% of the electricity coverage gap. Even if battery capacity were to triple to an unimaginable 1 TWh, this would still only cover 6% of the total load, less than half of the energy shortfall distributed unevenly throughout the year.
A capacity of more than 1 TWh is out of the question for both cost and CO₂balance reasons, especially since the photovoltaic share of the energy also has to be calculated at around 150 g/kWh of CO₂emissions. By comparison, a gas-fired power plant emits 400-500 g/kWh of CO₂.
In our publication, we simulated the seasonal storage of the last 10% using gas storage facilities, i.e., the production of hydrogen by electrolysis, the storage of hydrogen in gas caverns, and, if necessary, the recovery of electricity using gas-fired power plants or gas engines.
However, this option does not yet apply to the year 2030; it will be discussed in a further article.
For 2030, this means that the remaining 10%, or 66 GWh, will have to be provided by conventional power plants. In purely mathematical terms, this energy could be generated with 8 GW of power plant capacity (in continuous operation). Unfortunately, it is not possible to distribute this capacity arbitrarily throughout the year. It must be delivered precisely when there are gaps in the renewable energy supply.
The diagram in Fig. 11 shows the distribution of the power required. Up to 60 GW of additional power is needed simultaneously, albeit only for a few hours per year. For power plant operators, the requirement to maintain 60 GW of power for less than 300 hours per year is a nightmare. No one will voluntarily invest in such power plants with a utilization rate of less than 3.5%.
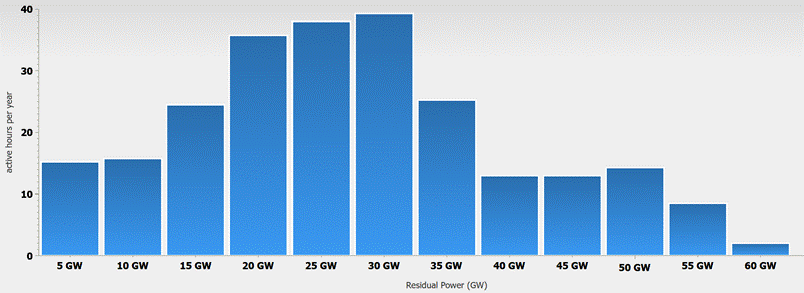
Fig. 11: Remaining demand for hours of additional power plant capacity
Conclusion – batteries do not solve the problem of volatile energy in Germany
Based on these considerations, it becomes clear that, at best, 4-6% of the required electrical energy can be provided by battery storage at a reasonable cost. With 300 GWh of battery storage expansion, this means €6 billion in annual costs for battery storage alone to cover just 4% of electricity demand, or 18 TWh. The electricity coming from the batteries therefore costs 33 ct/kWh in addition to the actual generation costs. Any further expansion of battery storage is out of the question, not only because of the immense costs (€2 billion for every 100 GWh), but also because of the increasing CO(2)emissions involved in manufacturing such large storage facilities ( ).
However, with a storage expansion of 300 GWh, not a single backup power plant can be dispensed with. Backup power plants must be able to absorb the full grid load.
Two significant problem areas have not yet been addressed, namely the additional grid expansion that battery storage entails. The reason why so many applications to build battery storage facilities are currently being rejected is that each large battery storage facility requires a correspondingly large amount of grid capacity. Since it is impossible to predict exactly when a battery storage facility will store or release electricity, the necessary capacity must be provided “on suspicion.”
Another problem area is the instantaneous reserve, which has so far been provided exclusively by the rotating masses of conventional power plants. Since the blackout in Spain, care has been taken to ensure that no more than 65% of electricity is generated from renewables[7] .
The scenario described in this article does not take this into account in order to explore the maximum possible potential of renewables and battery storage. For a realistic power supply secured by instantaneous reserves, the expected yields from renewables and battery storage are lower than described here due to the necessary instantaneous reserves, and the surpluses to be curtailed are greater.
[1]https://www.agora-energiewende.de/fileadmin/Projekte/2023/2023-30_DE_KNDE_Update/A-EW_344_Klimaneutrales_Deutschland_WEB.pdf
[2]The scenario is similar to that described in the interview https://www.youtube.com/watch?v=HgR6HHQIqtM, but differs in minor details.
[3]J. Dengler and B. Peters, Implications of Battery and Gas Storage for Germany’s National Energy Management with Increasing Volatile Energy Sources (2025): https://www.mdpi.com/2071-1050/17/12/5295
[4]https://www.cortima.com/energiewende/energytransition.html?scenarioSelect=2030&controlledRe=0&sourcefileSelect=2023
[5]Globally regional life cycle analysis of automotive lithium-ion nickel manganese cobalt batteries, 2019: https://link.springer.com/article/10.1007/s11027-019-09869-2
[6]https://bydbatterybox.com/uploads/downloads/bydbatteryboxpremiumhvlimitedwarrantygermanydev10-5e999139e16f3.pdf
[7]Can be determined using https://transparency.entsoe.eu/generation/r2/actualGenerationPerProductionType/show (select Spain as the country, choose a date in summer, chart)